Numerical reconstruction of large-scale pre-flare electric current sheet in the Sun’s corona
The solar dynamo continuously generates electric currents and magnetic fields to provide energy for various activities in the solar atmosphere, such as coronal heating, solar flares, and coronal mass ejection (CME). In the solar corona, the electric current usually exhibits two different forms; one is a tube-shaped volumetric current, which corresponds to the so-called magnetic flux rope, and the other takes the form of current sheet which is extremely thin layers of intensive current. Current sheet often forms at the interface separating different magnetic flux. When a current sheet is sufficiently thin, instability occurs and triggers the magnetic field to reconnect, such that the connectivity of the magnetic line changes, which is the core process of magnetic field energy dissipation and conversion. In the well-known standard model of solar flares, current sheet is the key structure formed during the occurrence of flares and CME. Parker’s theory of coronal heating points out that in fact, current sheets are ubiquitous in the corona. Even in the quiet period without flares, current sheets can spontaneously form, which is a basic process of magnetohydrodynamics (MHD). However, Parker's theory mainly refers to relatively small-scale current sheet structure, which is significantly smaller than the space size of the current sheet formed in solar flares.
Recently, Chaowei Jiang and colleagues of the Space Weather Storm Laboratory, for the first time, numerically reconstructed a large-scale current sheet existing prior to a solar flare. This current sheet forms in the active region numbered NOAA 11967, which produced a series of flares. In particular, the flare ribbons formed by three M-class flares presents a peculiar X shape (as shown in Figure 1), which is distinctly different from typical two-ribbon flares. By numerically reconstructing the magnetic field underlying this special flare, it is found that there is a quadrupolar magnetic structure in the active region, and at the core of the quadrupole magnetic field there is a vertically suspended large-scale current sheet (as shown in Figure 2). The current sheet has a spatial scale of about 30,000 kilometers and thickness close to the grid resolution (here is about 200 kilometers). If magnetic reconnection occurs in the current sheet, the rapidly released heat and high-energy particles will bombard the lower atmosphere along the magnetic field lines connecting the current sheet (that is, the magnetic field lines where magnetic reconnection is occurring), forming the flare brightening. The foot points of the reconnection line obtained by tracing field lines from the current sheet to the photosphere are almost identical to the observed flare ribbons (as shown in Figure 3). This coincidence confirms the basic idea of magnetic reconnection producing flares and provides an important basis for understanding such atypical and complex flare. More importantly, it demonstrated the reliability and power of their MHD numerical model. This model is one of the series of data-driven solar coronal magnetic field and evolution models that Jiang Chaowei and others have developed in recent years. It is of great significance to solar physics research and space weather modeling.
The work has been published in The Astrophysical Journal. It was based on a collaboration with University of Alabama, National Space Science Center, Yunnan Observatory, and University of Chinese Academy of Sciences.
Jiang et al. 2017. Reconstruction of a Large-scale Pre-flare Coronal Current Sheet Associated with a Homologous X-shaped Flare, ApJ, 850, 8
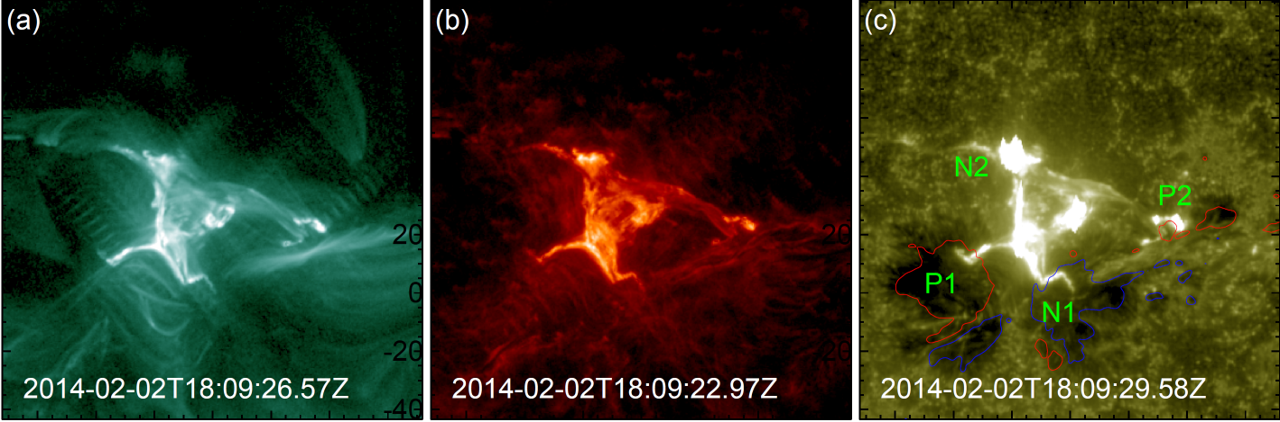
Figure 1: Solar Dynamics Observatory (SDO) observation of an M-class flare occurred in solar active region NOAA 11967.

Figure 2: The reconstructed current sheet structure. (A) The three-dimensional structure of the current sheet; (b) Several magnetic lines of force traced from the current sheet; (c) Cross-sectional view of the current sheet; (d) Footpoint map of the bottom surface of all magnetic lines of force in the current sheet.

Figure 3: Comparison of footpoints of magnetic field lines and flare ribbons.
 News & Events
 Research Trends